Code
# df_harvest_price <- read_excel(here::here("perso_projects/media/data_analyse_garden/recolte_total.xlsx")) %>%
#   rename("date"=Date_récolte) %>%
#   rename("qty"=`Quantité récolté`) %>%
#   rename("unite"=Expr1002) %>%
#   rename("price"=`Prix en magasin BIO`) %>%
#   rename("name"=`Nom (s) commun (s)`) %>%
#   rename("type"=`Type (Rotation)`) %>%
#   rename("total"=Expr1) %>%
#   dplyr::select(-Unités)

library(httr2)
library(jsonlite)
library(dplyr)

# 1) mets ta clé anon en variable d’environnement (une fois par session R)
Sys.setenv(SUPABASE_ANON_KEY = "eyJhbGciOiJIUzI1NiIsInR5cCI6IkpXVCJ9.eyJpc3MiOiJzdXBhYmFzZSIsInJlZiI6Inh5Z2N6cHdnb3dtbWFyZmt3ZGJjIiwicm9sZSI6ImFub24iLCJpYXQiOjE3NTY0OTUwNDYsImV4cCI6MjA3MjA3MTA0Nn0.euY43Bd9gJW4y2qvxjwAZqrP6RPQXmGwcpD1H1Qx_pg")

# 2) appel RPC dans le schéma 'garden'
SUPABASE_URL <- "https://xygczpwgowmmarfkwdbc.supabase.co"
ANON <- Sys.getenv("SUPABASE_ANON_KEY")
stopifnot(nchar(ANON) > 0)

req <- request(paste0(SUPABASE_URL, "/rest/v1/rpc/harvests_public_all")) |>
  req_method("POST") |>
  req_headers(
    apikey = ANON,
    Authorization = paste("Bearer", ANON),
    `Content-Type` = "application/json",
    Accept = "application/json",
    # 👇 indispensable quand la fonction est dans un autre schéma que 'public'
    `Content-Profile` = "garden",
    `Accept-Profile`  = "garden"
  ) |>
  req_body_json(list())  # pas de paramètres

# (optionnel) voir la requête construite
# req_dry_run(req)

resp <- req_perform(req)
stopifnot(resp_status(resp) < 300)
df <- resp_body_json(resp, simplifyVector = TRUE) |> tibble::as_tibble()
glimpse(df)
Rows: 69
Columns: 8
$ harvest_date <chr> "2025-10-21", "2025-10-19", "2025-10-10", "2025-09-28"…
$ created_by_name <chr> "Coco", "Coco", "Coco", "Coco", "Coco", "Coco", "Coco"…
$ product_name <chr> "Cucumber", "Zucchini", "Cherry", "Cherry", "Radish", …
$ variety <chr> "", "", "", "", "", "", "", "", "Kameor", "", "", "Bee…
$ harvest_unit <chr> "piece", "piece", "kg", "kg", "bunch", "kg", "bunch", …
$ quantity <dbl> 2, 2, 123, 2, 2, 9, 30, 28, 2, 2, 12, 123, 124, 23, 23…
$ location_name <chr> "MaslardFamilyGarden", "MaslardFamilyGarden", "Neuch_t…
$ note <chr> NA, "Test", NA, NA, NA, NA, NA, NA, NA, NA, NA, NA, NA…Code
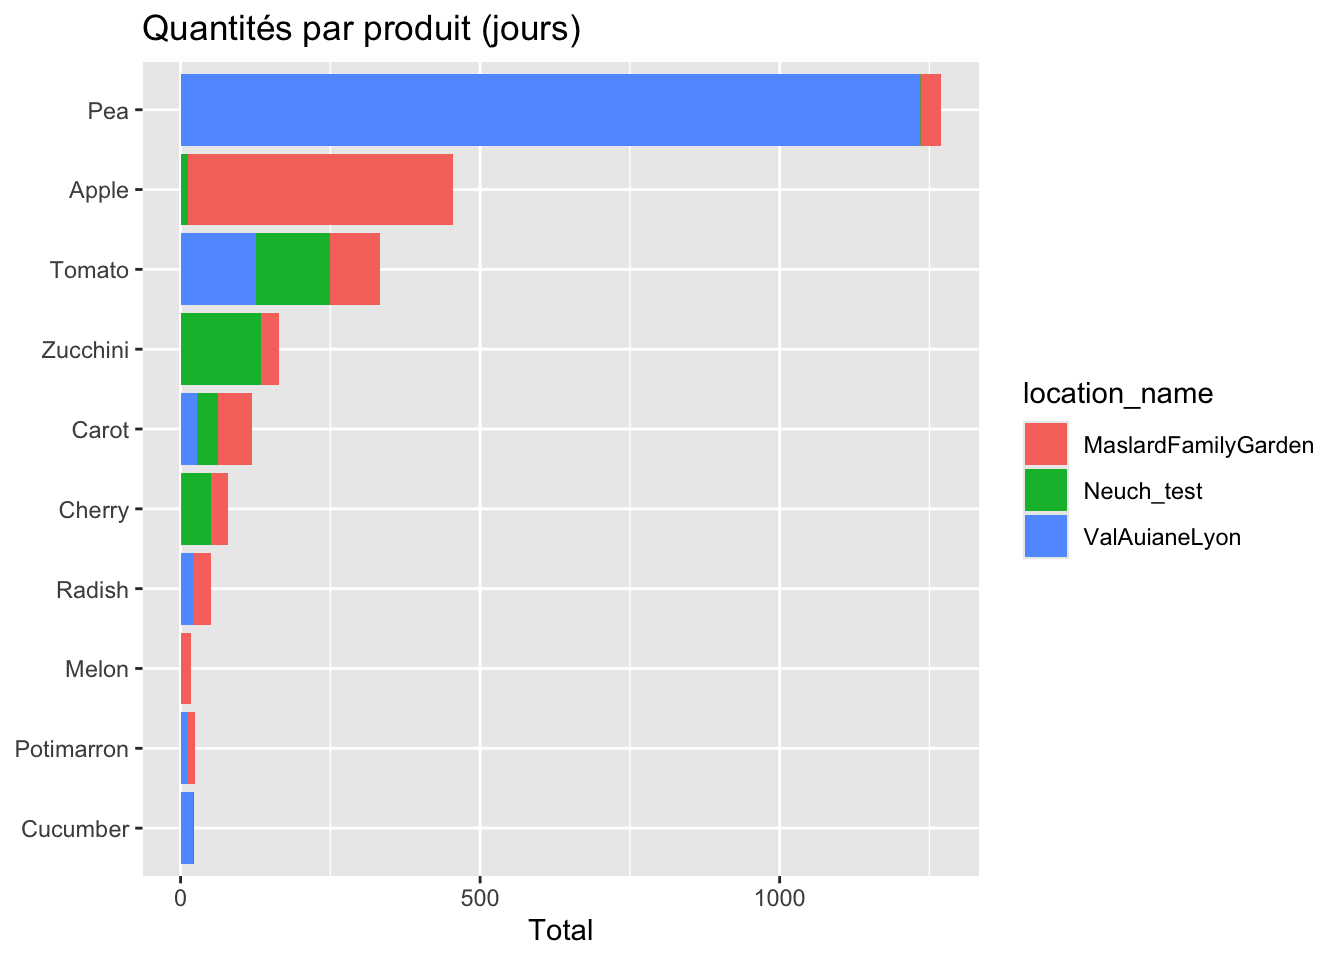
plot <- df %>%
  dplyr::group_by(product_name, location_name,created_by_name) %>%
  summarise(total = sum(quantity, na.rm=TRUE)) %>%
  ggplot(aes(x=reorder(product_name, total), y=total, fill = location_name)) +
  geom_col() +
  coord_flip() +
  #facet_grid(.~created_by_name)+
  labs(x=NULL, y='Total', title=sprintf('Quantités par produit (jours)'))
`summarise()` has grouped output by 'product_name', 'location_name'. You can
override using the `.groups` argument.Code
#ggsave('chart.png', plot, width=8, height=5, dpi=150)
#dbDisconnect(con)
plot