---
output: html_document
editor_options:
chunk_output_type: console
---
## Calcul of Radiation Use Efficiency
```{r}
# pkg ----
library(tidyr)
library(stringr)
library(dplyr)
library(readxl)
#src ----
source(here::here("src/function/stat_function/stat_analysis_main.R")) # for make plot

#data import  ----
df_physio=read.csv2(here::here("data/physio/global_physio.csv")) %>%
  drop_na(sum_biomass,leaf_area)

# cosmetics
climate_pallet=read_excel(here::here("data/color_palette.xlsm")) %>%
      filter(set == "climat_condition") %>%
      dplyr::select(color, treatment) %>%
      pull(color) %>%
      setNames(read_excel(here::here("data/color_palette.xlsm")) %>%
                 filter(set == "climat_condition") %>%
                 pull(treatment)
               )

set.seed(1)
```
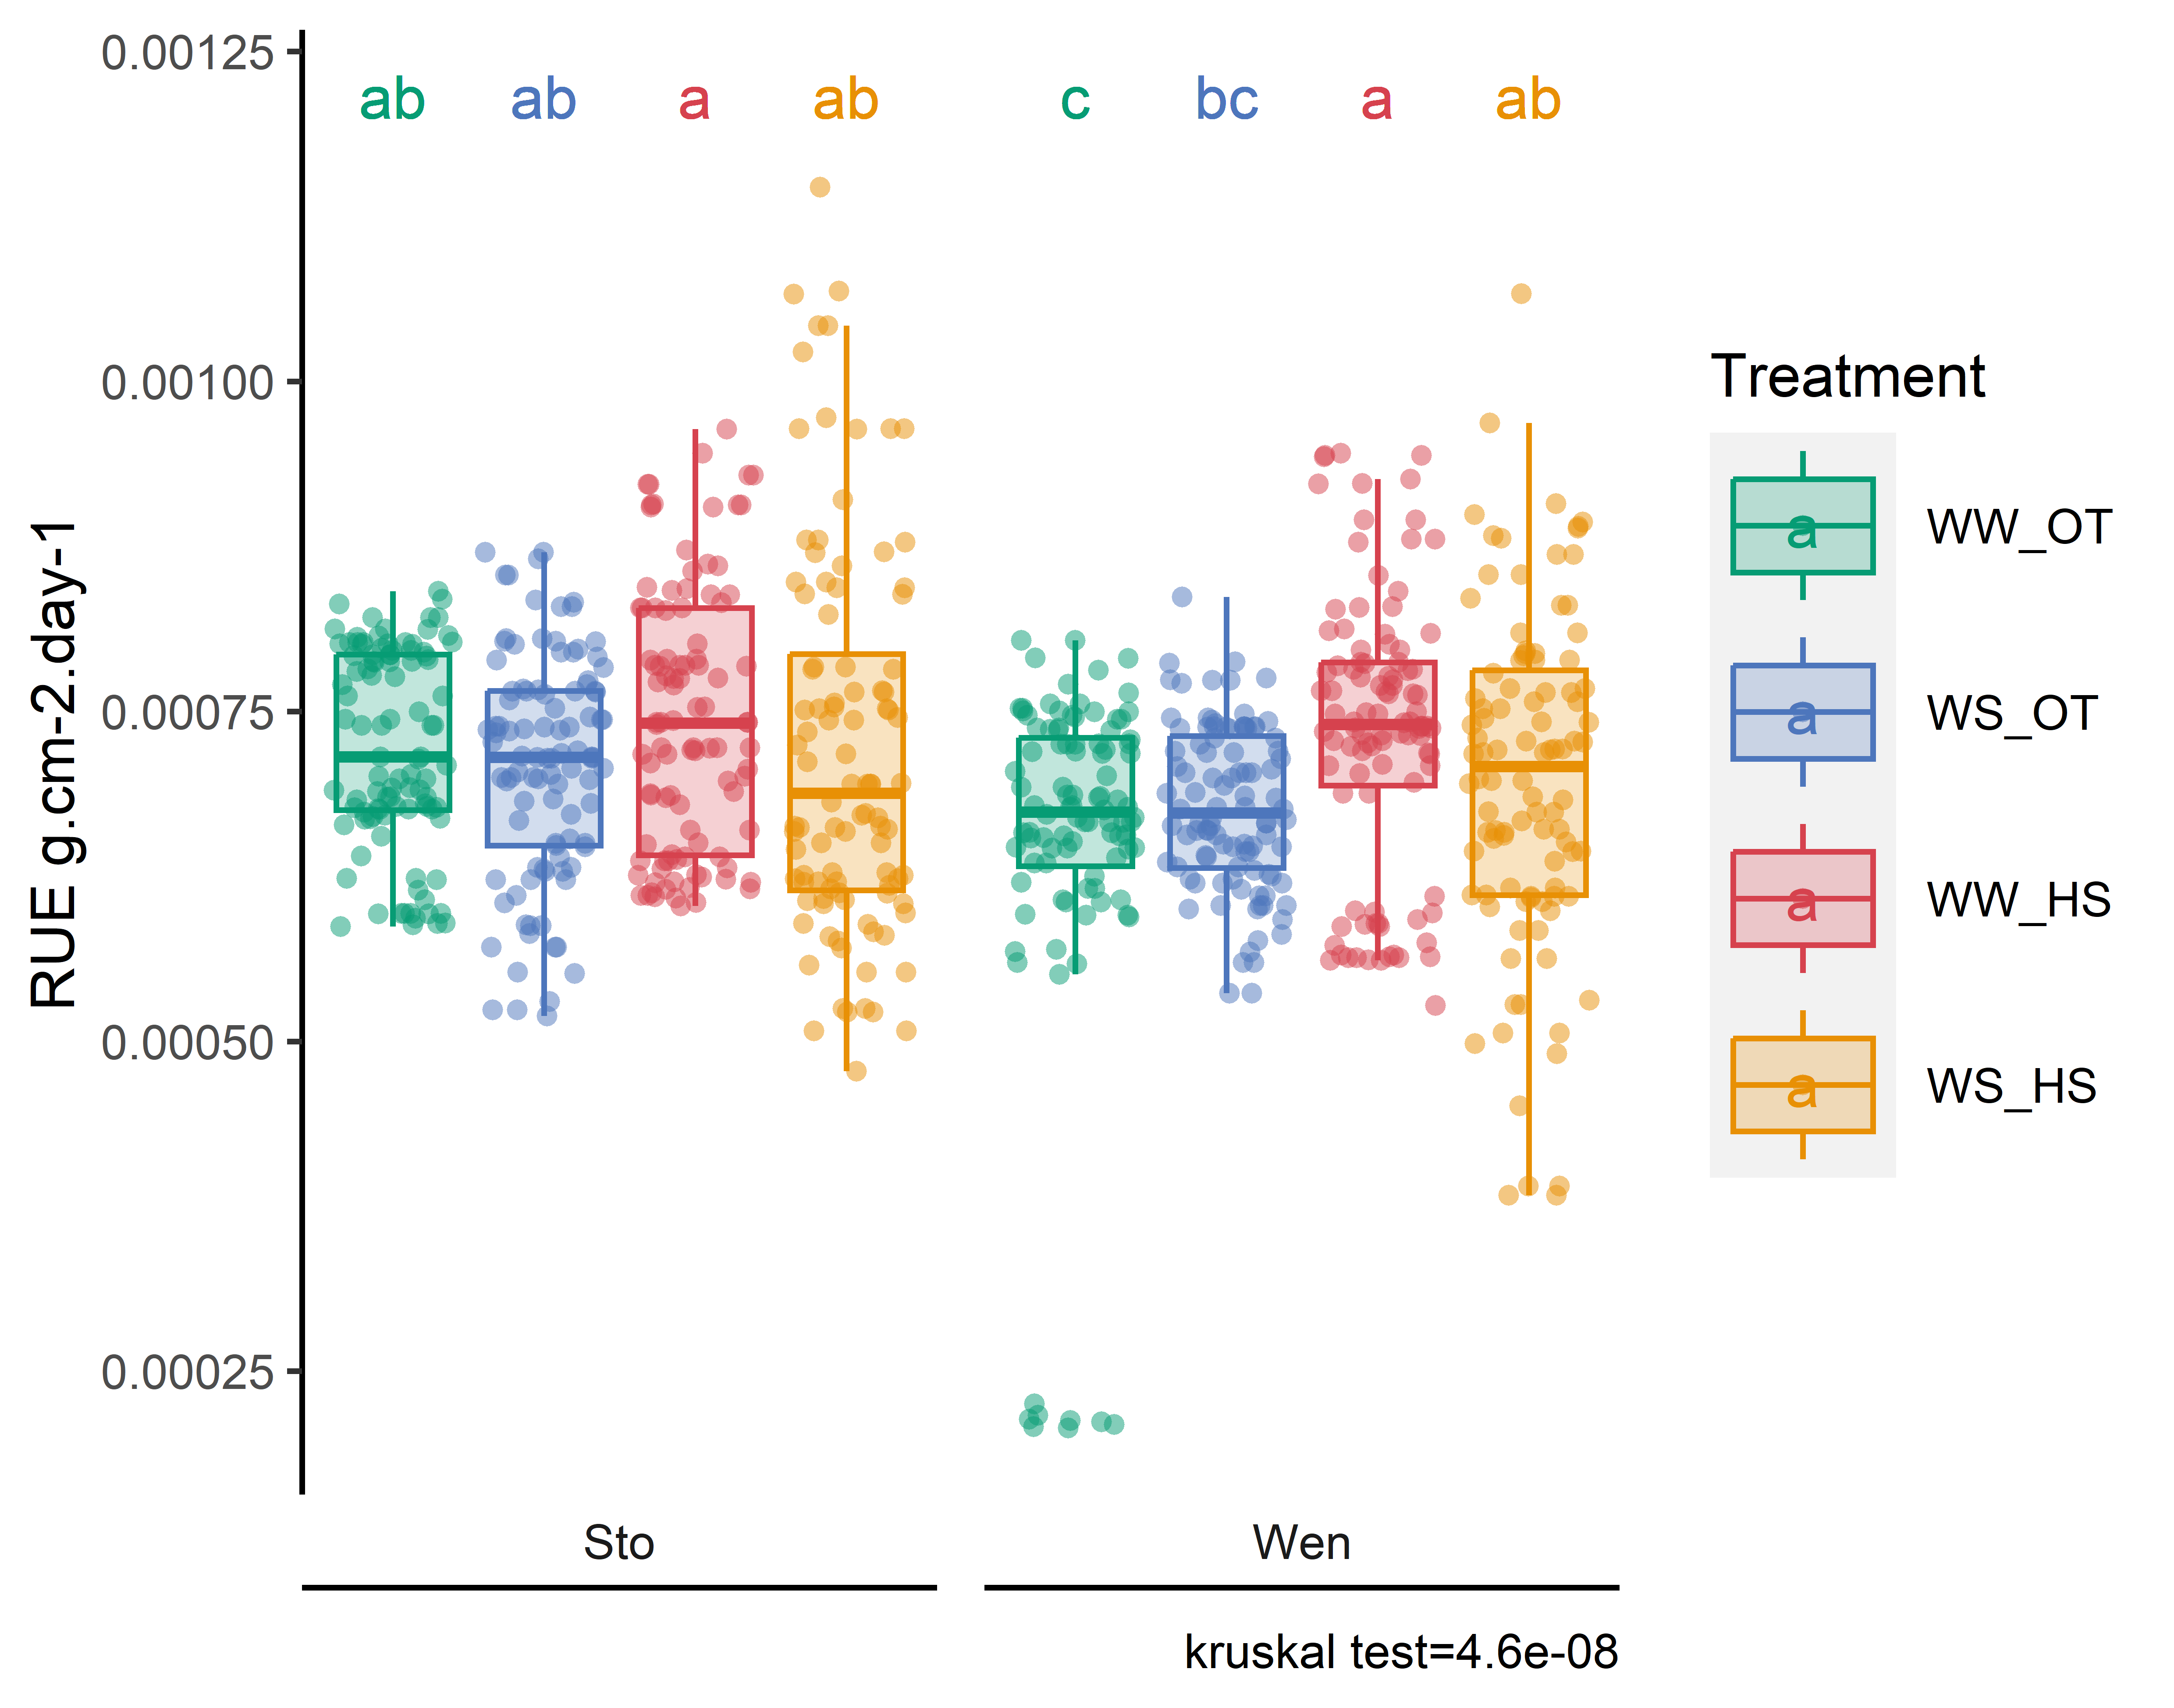
## Methode Bootstrap
*Execution of the bootstrap*
```{r,eval=F}
# parameter ----
rep=100

# calcul ----

# colnames(df_physio)
df_compile=data.frame()
list_condition=c("Sto_WW_OT","Sto_WS_OT","Sto_WW_HS","Sto_WS_HS","Wen_WW_OT","Wen_WS_OT","Wen_WW_HS","Wen_WS_HS")

for(cond in list_condition){
  for (i in 1:rep){
    #For H2
    df_r2=df_physio %>% dplyr::filter(recolte=="2") %>%  dplyr::filter(condition==cond)
    df_r2_taking=df_r2 %>% dplyr::filter(plant_num==sample(df_r2$plant_num,1,replace=T))   %>% dplyr::select(sum_biomass,condition,plant_num,recolte,date_recolte,leaf_area)

    #For H1
    if(str_sub(df_r2_taking$condition, 1, 3)=="Sto"){
      df_r1=df_physio %>% dplyr::filter(recolte=="1")  %>% dplyr::filter(condition=="Sto_WW_OT")
      df_r1_taking=df_r1 %>%dplyr:: filter(plant_num==sample(df_r1$plant_num,1,replace=T))   %>% dplyr::select(sum_biomass,condition,plant_num,recolte,date_recolte,leaf_area)

    }else {
      df_r1=df_physio %>% dplyr::filter(recolte=="1")  %>% dplyr::filter(condition=="Wen_WW_OT")
      df_r1_taking=df_r1 %>% dplyr::filter(plant_num==sample(df_r1$plant_num,1,replace=T))   %>% dplyr::select(sum_biomass,condition,plant_num,recolte,date_recolte,leaf_area)
    }

    colnames(df_r1_taking)=c("sum_biomass_r1" ,"condition_r1" ,"plant_num_r1","recolte_r1","date_recolte_r1","leaf_area_r1")
    colnames(df_r2_taking)=c("sum_biomass_r2" ,"condition_r2" ,"plant_num_r2","recolte_r2","date_recolte_r2","leaf_area_r2")

    df_bind=cbind(df_r2_taking,df_r1_taking)
    df_bind$rep=i

    #calcul
    df_bind$RUE=(df_bind$sum_biomass_r2-df_bind$sum_biomass_r1)/
      (( (as.numeric(as.Date(df_bind$date_recolte_r2)-as.Date(df_bind$date_recolte_r1))) * ((df_bind$leaf_area_r2+df_bind$leaf_area_r1)/2)))
    df_compile=rbind(df_compile,df_bind)
  }
  cat(cond,"\n")
}

df_compile$compile_rep=paste(sep="_",df_compile$rep,df_compile$condition_r2)

#write result
write.csv(df_compile,here::here(paste(sep="_","data/physio/output/random_drawing_RUE", "rep",rep,".csv")))
```
*Visualisation of the result*
```{r,eval=F}
df_RUE=read.csv(here::here("data/physio/output/random_drawing_RUE_rep_100_.csv"))[-1] %>%
  dplyr::rename(condition=condition_r2) %>%
  separate(condition, remove = F,c("genotype","water_condition","heat_condition")) %>%
  mutate(climat_condition =paste0(water_condition, "_", heat_condition))

# analyse
plot_x=stat_analyse(
    data=df_RUE %>%
      #filter(compartment=="Bulk") %>%
      drop_na(genotype,climat_condition, RUE) %>%
      dplyr::select(genotype, condition, water_condition, heat_condition,compile_rep,climat_condition,RUE) %>%
       mutate(condition = case_when(
    condition == "Stocata_WW_OT" ~ "Sto_WW_OT",
    condition == "Stocata_WS_OT" ~ "Sto_WS_OT",
    condition == "Stocata_WW_HS" ~ "Sto_WW_HS",
    condition == "Stocata_WS_HS" ~ "Sto_WS_HS",
    condition == "Wendy_WW_OT" ~ "Wen_WW_OT",
    condition == "Wendy_WS_OT" ~ "Wen_WS_OT",
    condition == "Wendy_WW_HS" ~ "Wen_WW_HS",
    condition == "Wendy_WS_HS" ~ "Wen_WS_HS",
    TRUE ~ condition  # Keep other values unchanged
  )) %>%
    mutate(condition=factor(condition,levels=c("Sto_WW_OT","Stoc_WS_OT","Sto_WW_HS","Sto_WS_HS","Wen_WW_OT","Wen_WS_OT","Wen_WW_HS","Wen_WS_HS"))) %>%
    mutate(climat_condition=factor(climat_condition,levels=c("WW_OT","WS_OT","WW_HS","WS_HS"))),
    column_value = "RUE",
    category_variables = c("climat_condition"),
    grp_var = "genotype",
    show_plot = T,
    outlier_show = F,
    label_outlier = "compile_rep",
    biologist_stats = T,
    Ylab_i = paste0("RUE g.cm-2.day-1"),
  control_conditions = c("WW_OT"),
  hex_pallet = climate_pallet,
  strip_normale = F
)

# export
png(here::here("report/physio/plot/RUE_bootstrap.png"), width = 14, height = 11, units = 'cm', res = 900)
gridExtra::grid.arrange (plot_x[["plot"]]+labs(fill = "Treatment", color="Treatment"))
dev.off()
```
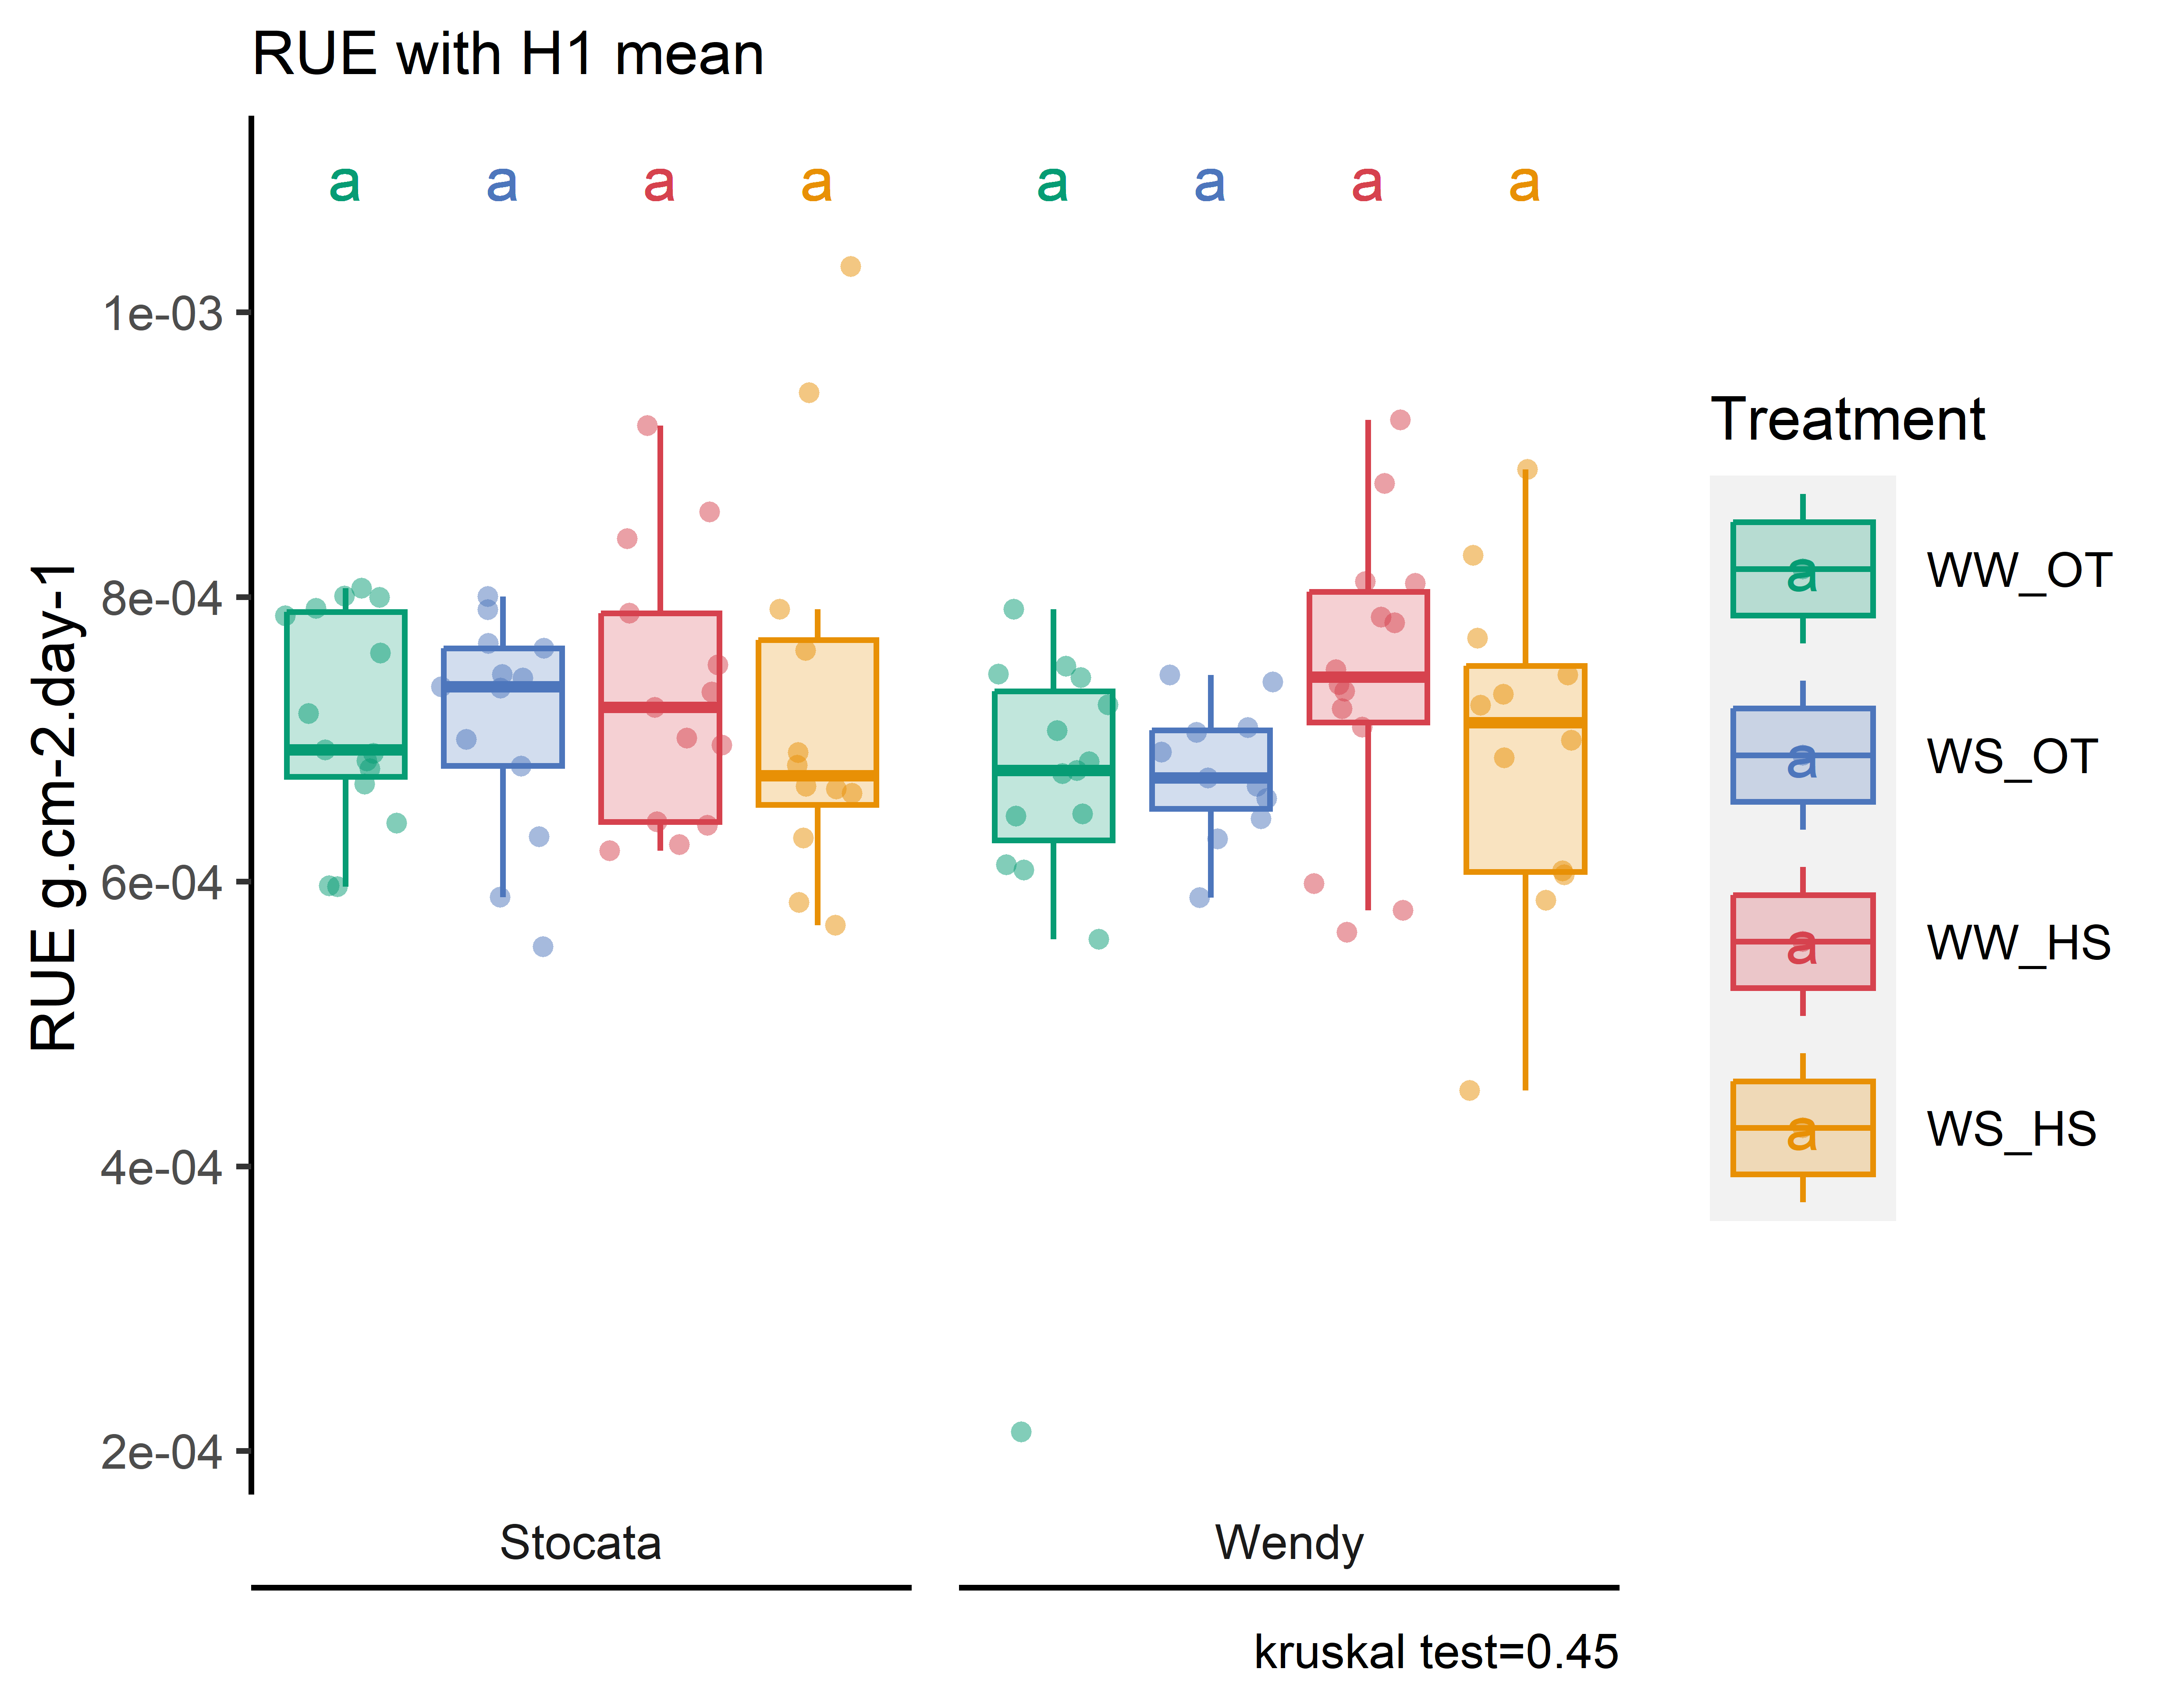
## Methode Mean for Harvest 1
```{r, eval=F}
# Data importation and preparation for H1 and H2
## Mean of H1
df_H1_mean<-read.csv2(here::here("data/physio/global_physio.csv")) %>%
              dplyr::select(plant_id, plant_num,genotype,date_recolte,recolte,sum_biomass, leaf_area, condition) %>% filter(recolte==1) %>%
              drop_na(sum_biomass,leaf_area) %>%
  dplyr::group_by(condition, genotype,recolte,date_recolte) %>%
  dplyr::summarise(across(sum_biomass : leaf_area, ~ mean(.x, na.rm = TRUE))) %>%
  dplyr::rename_all(~ paste0(., "_H1")) %>%
  dplyr::rename(genotype=genotype_H1)

df_H2<-read.csv2(here::here("data/physio/global_physio.csv")) %>%
              dplyr::select(plant_id, plant_num,genotype,date_recolte,recolte,sum_biomass, leaf_area, condition) %>% filter(recolte==2) %>%
              drop_na(sum_biomass,leaf_area) %>%
  dplyr::group_by(plant_id, plant_num,condition, genotype,recolte,date_recolte) %>%
  dplyr::summarise(across(sum_biomass : leaf_area, ~ mean(.x, na.rm = TRUE))) %>%
  dplyr::rename_all(~ paste0(., "_H2")) %>%
  dplyr::rename(genotype=genotype_H2)

# Process RUE
RUE_1mean=full_join(df_H2, df_H1_mean, by="genotype",relationship = "many-to-many") %>%
  #calcul
  mutate(RUE=(sum_biomass_H2-sum_biomass_H1)/
      (( (as.numeric(as.Date(date_recolte_H2)-as.Date(date_recolte_H1))) * (leaf_area_H2+leaf_area_H1)/2))) %>%

  dplyr::rename(condition=condition_H2) %>%
  mutate(water_condition=str_sub(condition, 5, 6)) %>%
  mutate(heat_condition=str_sub(condition, 8, 9)) %>%
  mutate(climat_condition=paste0(water_condition, "_", heat_condition)) %>%
  mutate(condition=factor(condition,levels=c("Sto_WW_OT","Sto_WS_OT","Sto_WW_HS","Sto_WS_HS","Wen_WW_OT","Wen_WS_OT","Wen_WW_HS","Wen_WS_HS"))) %>%
  mutate(climat_condition=factor(climat_condition,levels=c("WW_OT","WS_OT","WW_HS","WS_HS")))

# export results
write.csv(RUE_1mean,here::here(paste(sep="_","data/physio/output/RUE_1mean.csv")))

# Show results
pRUE=stat_analyse(data =RUE_1mean,
                column_value = "RUE",
                category_variables = c("climat_condition"),
                grp_var = "genotype",
                control_conditions = c("WW_OT"),
                biologist_stats = T,
                strip_normale = F,
                outlier_show = F,
                label_outlier = "plant_num_H2",
                show_plot = T,
                hex_pallet = climate_pallet,
                Ylab_i = "RUE g.cm-2.day-1"
             )

pRUE<-pRUE[["plot"]]+labs(color="Treatment",fill="Treatment")+
  theme(axis.title.x=element_blank(),
        axis.text.x=element_blank(),
        panel.grid.major = element_blank(),
        panel.grid.minor = element_blank(),
        axis.ticks.x = element_blank()
        )+labs(subtitle = "RUE with H1 mean")


# export
png(here::here("report/physio/plot/RUE_1mean.png"), width = 14, height = 11, units = 'cm', res = 900)
gridExtra::grid.arrange (pRUE)
dev.off()
```